A Basics of value stream mapping
This appendix gives a short recap of VSM. Readers are referred to Rother and Shook (1999) if this material does not seem familiar. We first review some common VSM symbols. We then consider the structure of a generic VSM.
A.1 Common value stream mapping symbols
Figure A.1 illustrates some common symbols in a VSM.
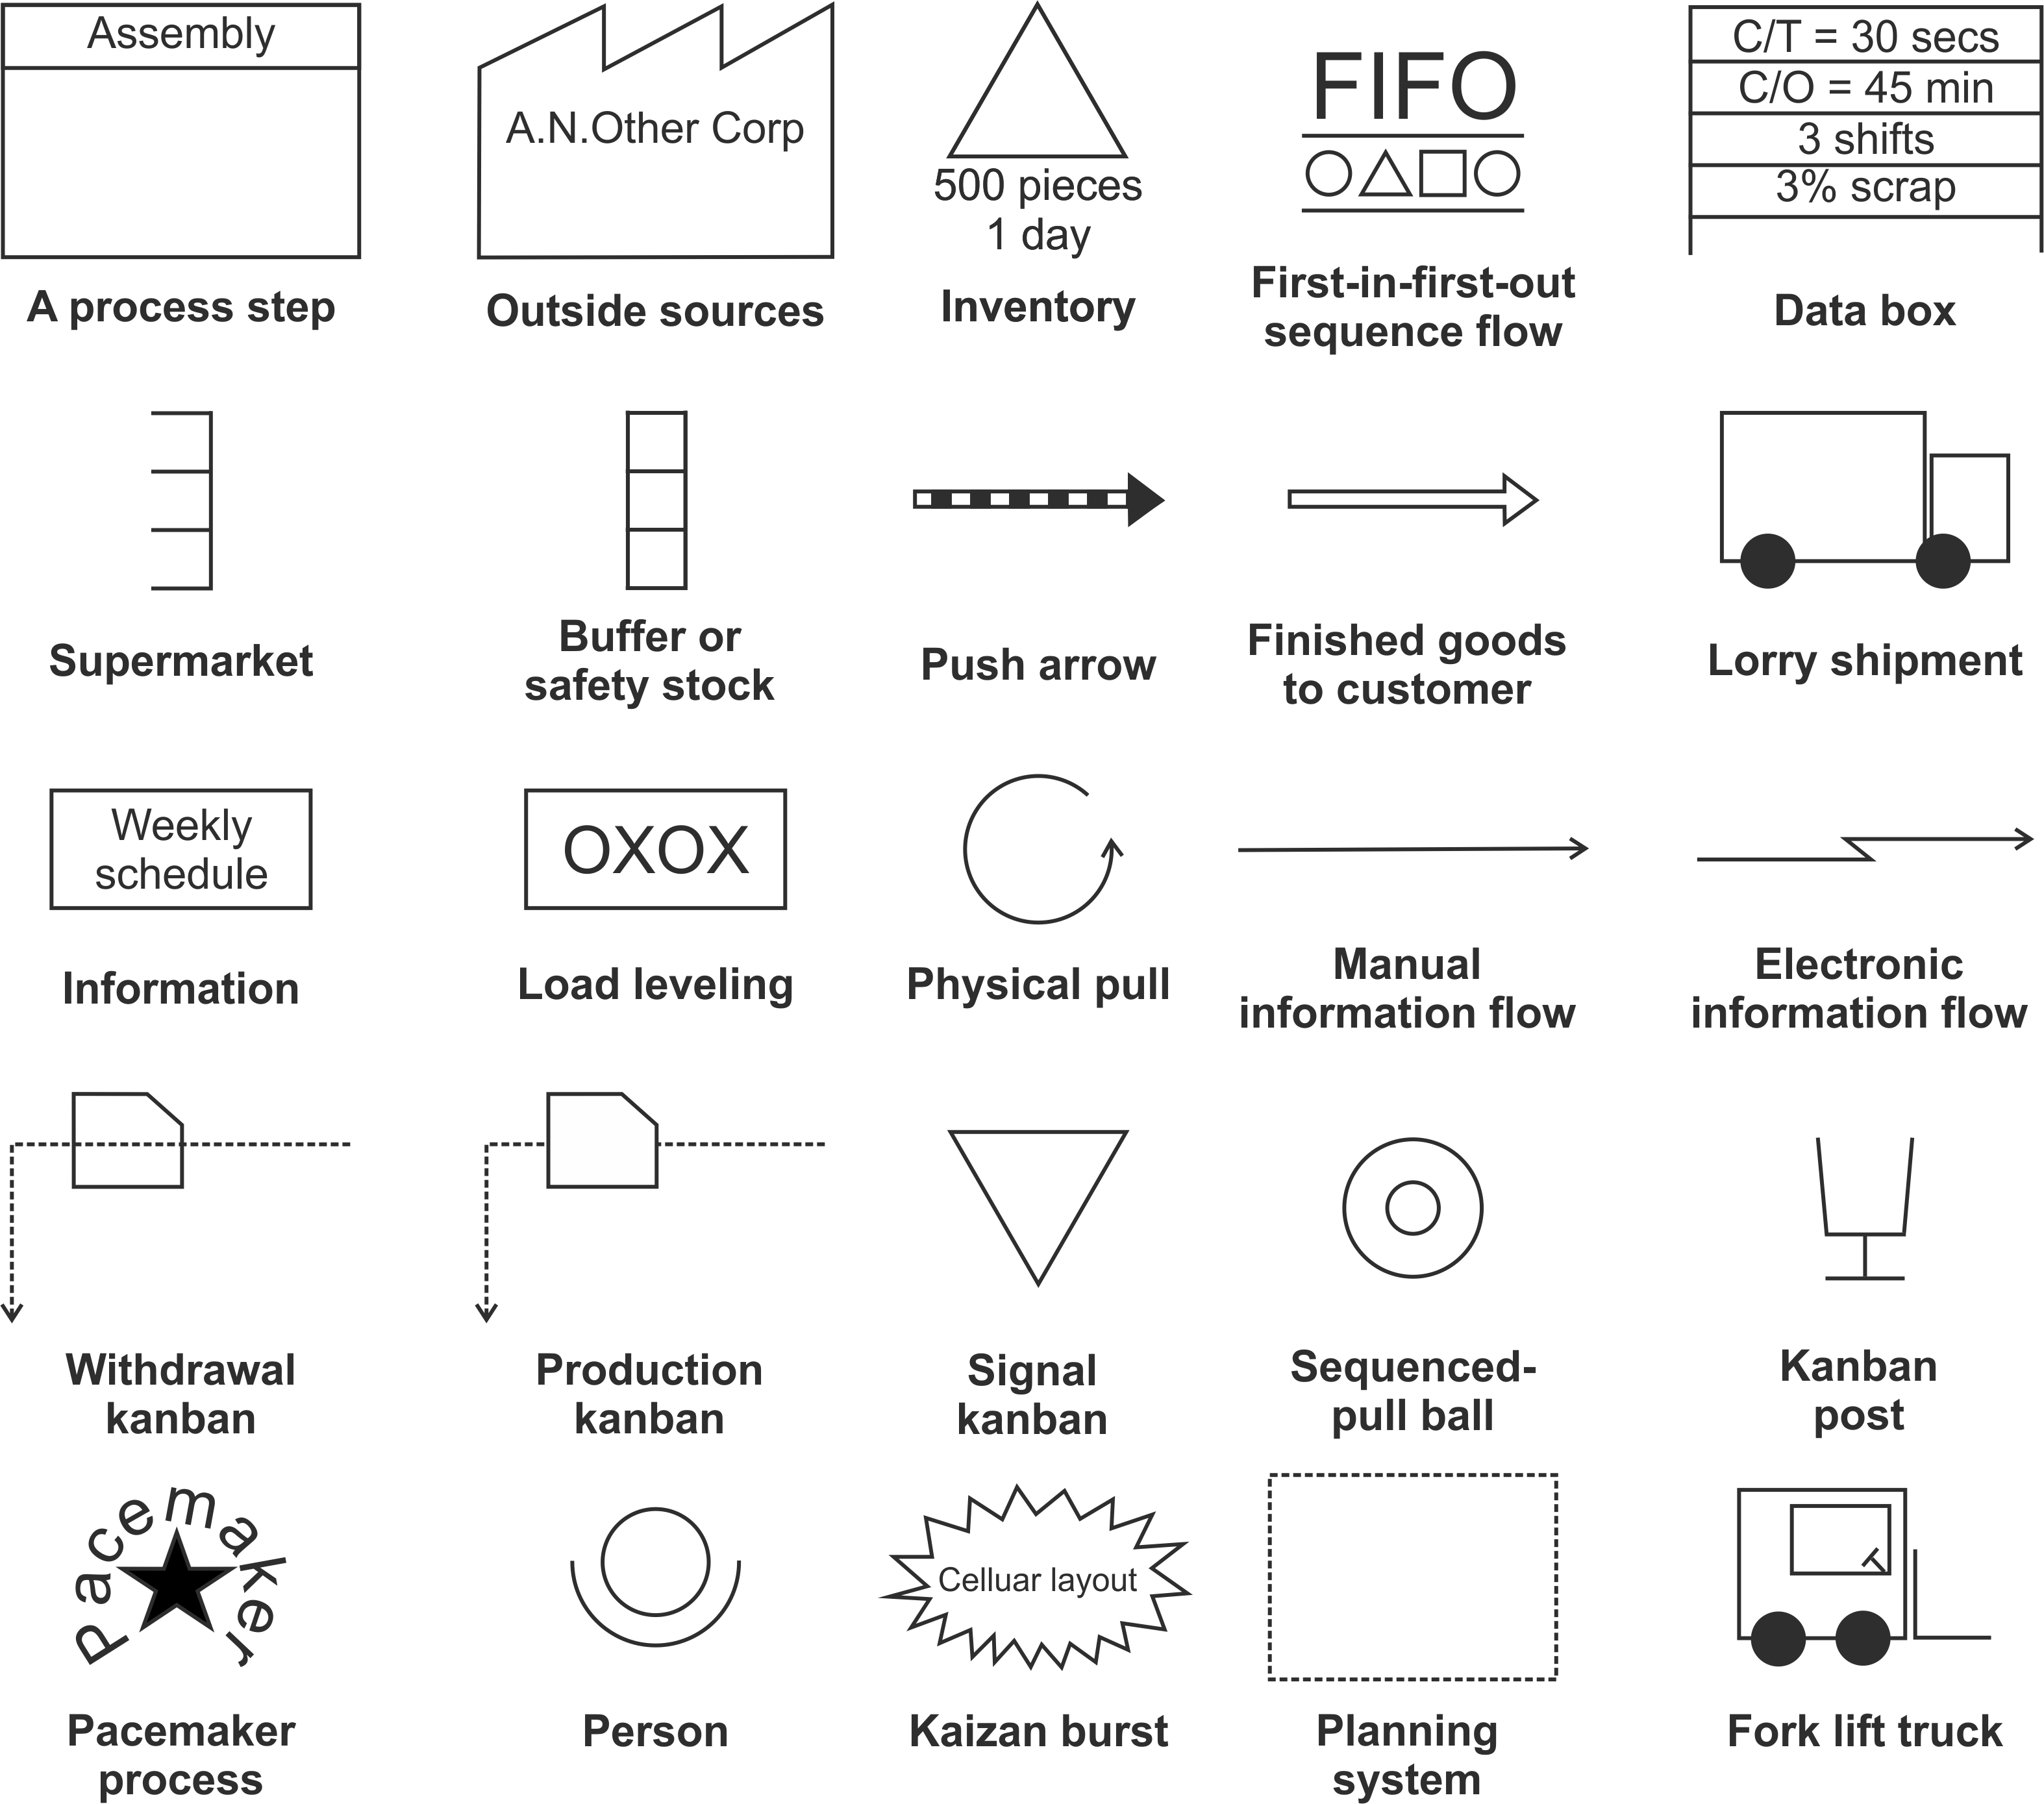
Figure A.1: Common value stream mapping symbols
Each of the VSM symbols is briefly described below.
Process step. A process step is a collection of many process steps. Rather than detailing individual process steps like we would in traditional process mapping (where we document each operation, transport, inspection, delay, and inventory in detail), in a VSM we aggregate chunks of operations into a single high level process step. We do this so we can consider whole companies or whole supply chains in a single map without introducing too much clutter.
Outside sources. Outside sources are customers or suppliers. Customers are placed in the top right hand corner of the VSM, suppliers are placed in the top left hand corner of the VSM. There may be more that one customer or supplier, depending on the focus of your VSM.
Inventory. A location where inventory is purposely stored. Inventory stored without a purpose is a waste, a delay. The size of the inventory may also be indicated, either a quantity or as the length of time (that is, ‘5 days’ is enough inventory to satisfy five days of average demand).
FIFO. The first in first out queue discipline. Two process steps can be joined together by the FIFO queue. The following process step simply produces what is passed to it from the preceding process, in the order the work is received. There are other queue disciples (LIFO - Last In First Out, HPF - Highest Priority First, for example) but FIFO is the most common discipline in a lean production system where production attempts to follow demand as closely as possible.
Data box. Traditionally, beneath a process step box we would add information like cycle time (C/T), the available capacity. changeover times (C/O), quality defect rates, OEE measurements and the like. However, in a dynamic VSM, we use that space to document aggregate dynamic information such as the mean and variance of the demand, orders, and inventory levels, safety stock targets, capacity levels, and ranges (such as maximums and minimums).
Supermarket. The open box is a kanban supermarket. It is nothing to do with a grocery store, but is rather a storage (and kanban system) placed between two process steps. When the downstream process step wants some raw materials, the operator simply goes to the supermarket and takes the raw material needed. The empty shelf then becomes the kanban (the permission) for the supplying process to initiate production to fill the empty shelf. If the supermarket is full the supplying process stops production. Hence the supermarket symbol is often combined with the physical pull arrow.
Buffer or safety stock. A closed box is a buffer or safety stock. Sometimes it is advantageous to hold a buffer stock immediately before a bottleneck process (the slowest process in the value stream) to ensure the bottleneck machine is not starved of its raw material. This is especially true when capacity is tight as ‘an hour lost at the bottleneck machine is an hour lost for the whole factory’.
Push arrow. When a process step is controlled, or scheduled, directly from an MRP system, we say a push system is present. A push arrow is used to illustrate the pushed information being sent to the process step.
Transportation arrow. A large open arrow is used signify FGI being delivered to a customer or the RMI being delivered from a supplier.
Lorry shipment. Transportation by a truck, or lorry. May contain extra information like the distance travel, or the duration of the journey, or the frequency the lorry makes the trip. Planes, trains, ships may also be used and would have a corresponding symbol.
Information. Information flows can be named by placing the name in a box.
Load levelling. In some production systems the production of two or more products may be interlaced (that is, produce one of product A, then one of product B, then A, then B…) is order to balance the cycle times/work loads.
Physical pull. The physical pull symbol is associated with the act of physically getting the materials required to be processed by a process step. This physical movement could be done by the operator of the process or the movement could be done a specialist material handler, sometimes called a ‘water spider’. Usually associated with a supermarket,
Manual information flow. A straight arrow indicates information is being transferred manually. This could be in the form of a physical kanban card being moved. Or a kanban could be an empty crate or box being moved to a supplying process and the empty crate or box is the signal to initiate production.
Electric information flow. An arrow with an lightening kink indicates information is being transferred electronically; email, fax, and EDIFACT messages are examples of electronic information flows. EDIFACT is an acronym for Electronic Data Interchange for Administration, Commerce and Transport.
Withdrawal kanban. A withdrawal kanban (usually a card, but could also be an empty crate or box) is a symbol used to indicate that some raw materials should be withdrawn from the supermarket (or raw material stores) and delivered to the process. This could be done either by the process operator or a water spider. Kanbans (cards or boxes) usually have information associated with them such as the part/material name, SKU or part number, the external supplier or internal supplying process (so the water spider knows where to send the withdrawal kanban), the batch quantity (how many parts fit in the box), a storage address, and consuming process address.
Production kanban. A production kanban (usually a card, but could also be an empty crate or box) is a symbol used to indicate that production of some materials should be initiated and delivered to the supermarket or stores. This could be done either by the process operator or a water spider.
Signal kanban. A type of kanban used to trigger production when a re-order point is reached in a production process with large changeover times and short cycle times (for example, a press controlled by an Economic Order Quantity).
Sequence-pull ball. One way to pass a kanban from one process to another is to roll a colored golf ball down a tube. The colour of the ball could represent which product to produce, a white ball for product A, a yellow ball for product B, for example. A cheap and easy-to-install communication device that preserves the order of the balls.
Kanban post. A place to put physical kanbans. It could be a shelf, a box, a bin.
Pacemaker process. This is the process step where the production plan is set, detailing the quantity that should be produced. If more that one product is produced in a planning period, it may also specify the order in which the products should be produced.
Person. The number of people in a process step can be indicated with this ‘view from above’.
Kaizen burst. Kaizen is the Japanese word for ‘to make better’. A kaizen burst is a rapid process improvement (usually over two or three days) where workers make a positive change to their work or work environment.
Planning system. The planning system may be a single IT system, like and ERP software, or a collection of different software packages and company departments. For example there may be a commercial department (that receives demand from customers, a forecasting department, forecasting customer demand,
Fork lift truck. A method of transportation, usually used in a warehouse.
Of course, other symbols can be developed and used as required for the situation and circumstances that you are studying.
A.2 Structure of a value stream map
Figure A.2 shows a typical VSM. The customer(s) is always placed in the top right hand corner of the map. The supplier(s) is placed in the top left hand corner of the map. Along the bottom, flowing left to right, is the material flow. In the middle of the map it the information flow. In the bottom left hand corner is the RMI. Deliveries from the supplier into the RMI are illustrated with the big open, downward pointing arrow. The transportation mode is also illustrated here. In the bottom right hand corner is the FGI, from which we satisfy customer demand. Deliveries from the FGI to the customer are illustrated by the big open arrow, upward pointing arrow. The transportation mode is associated with the delivery arrow.
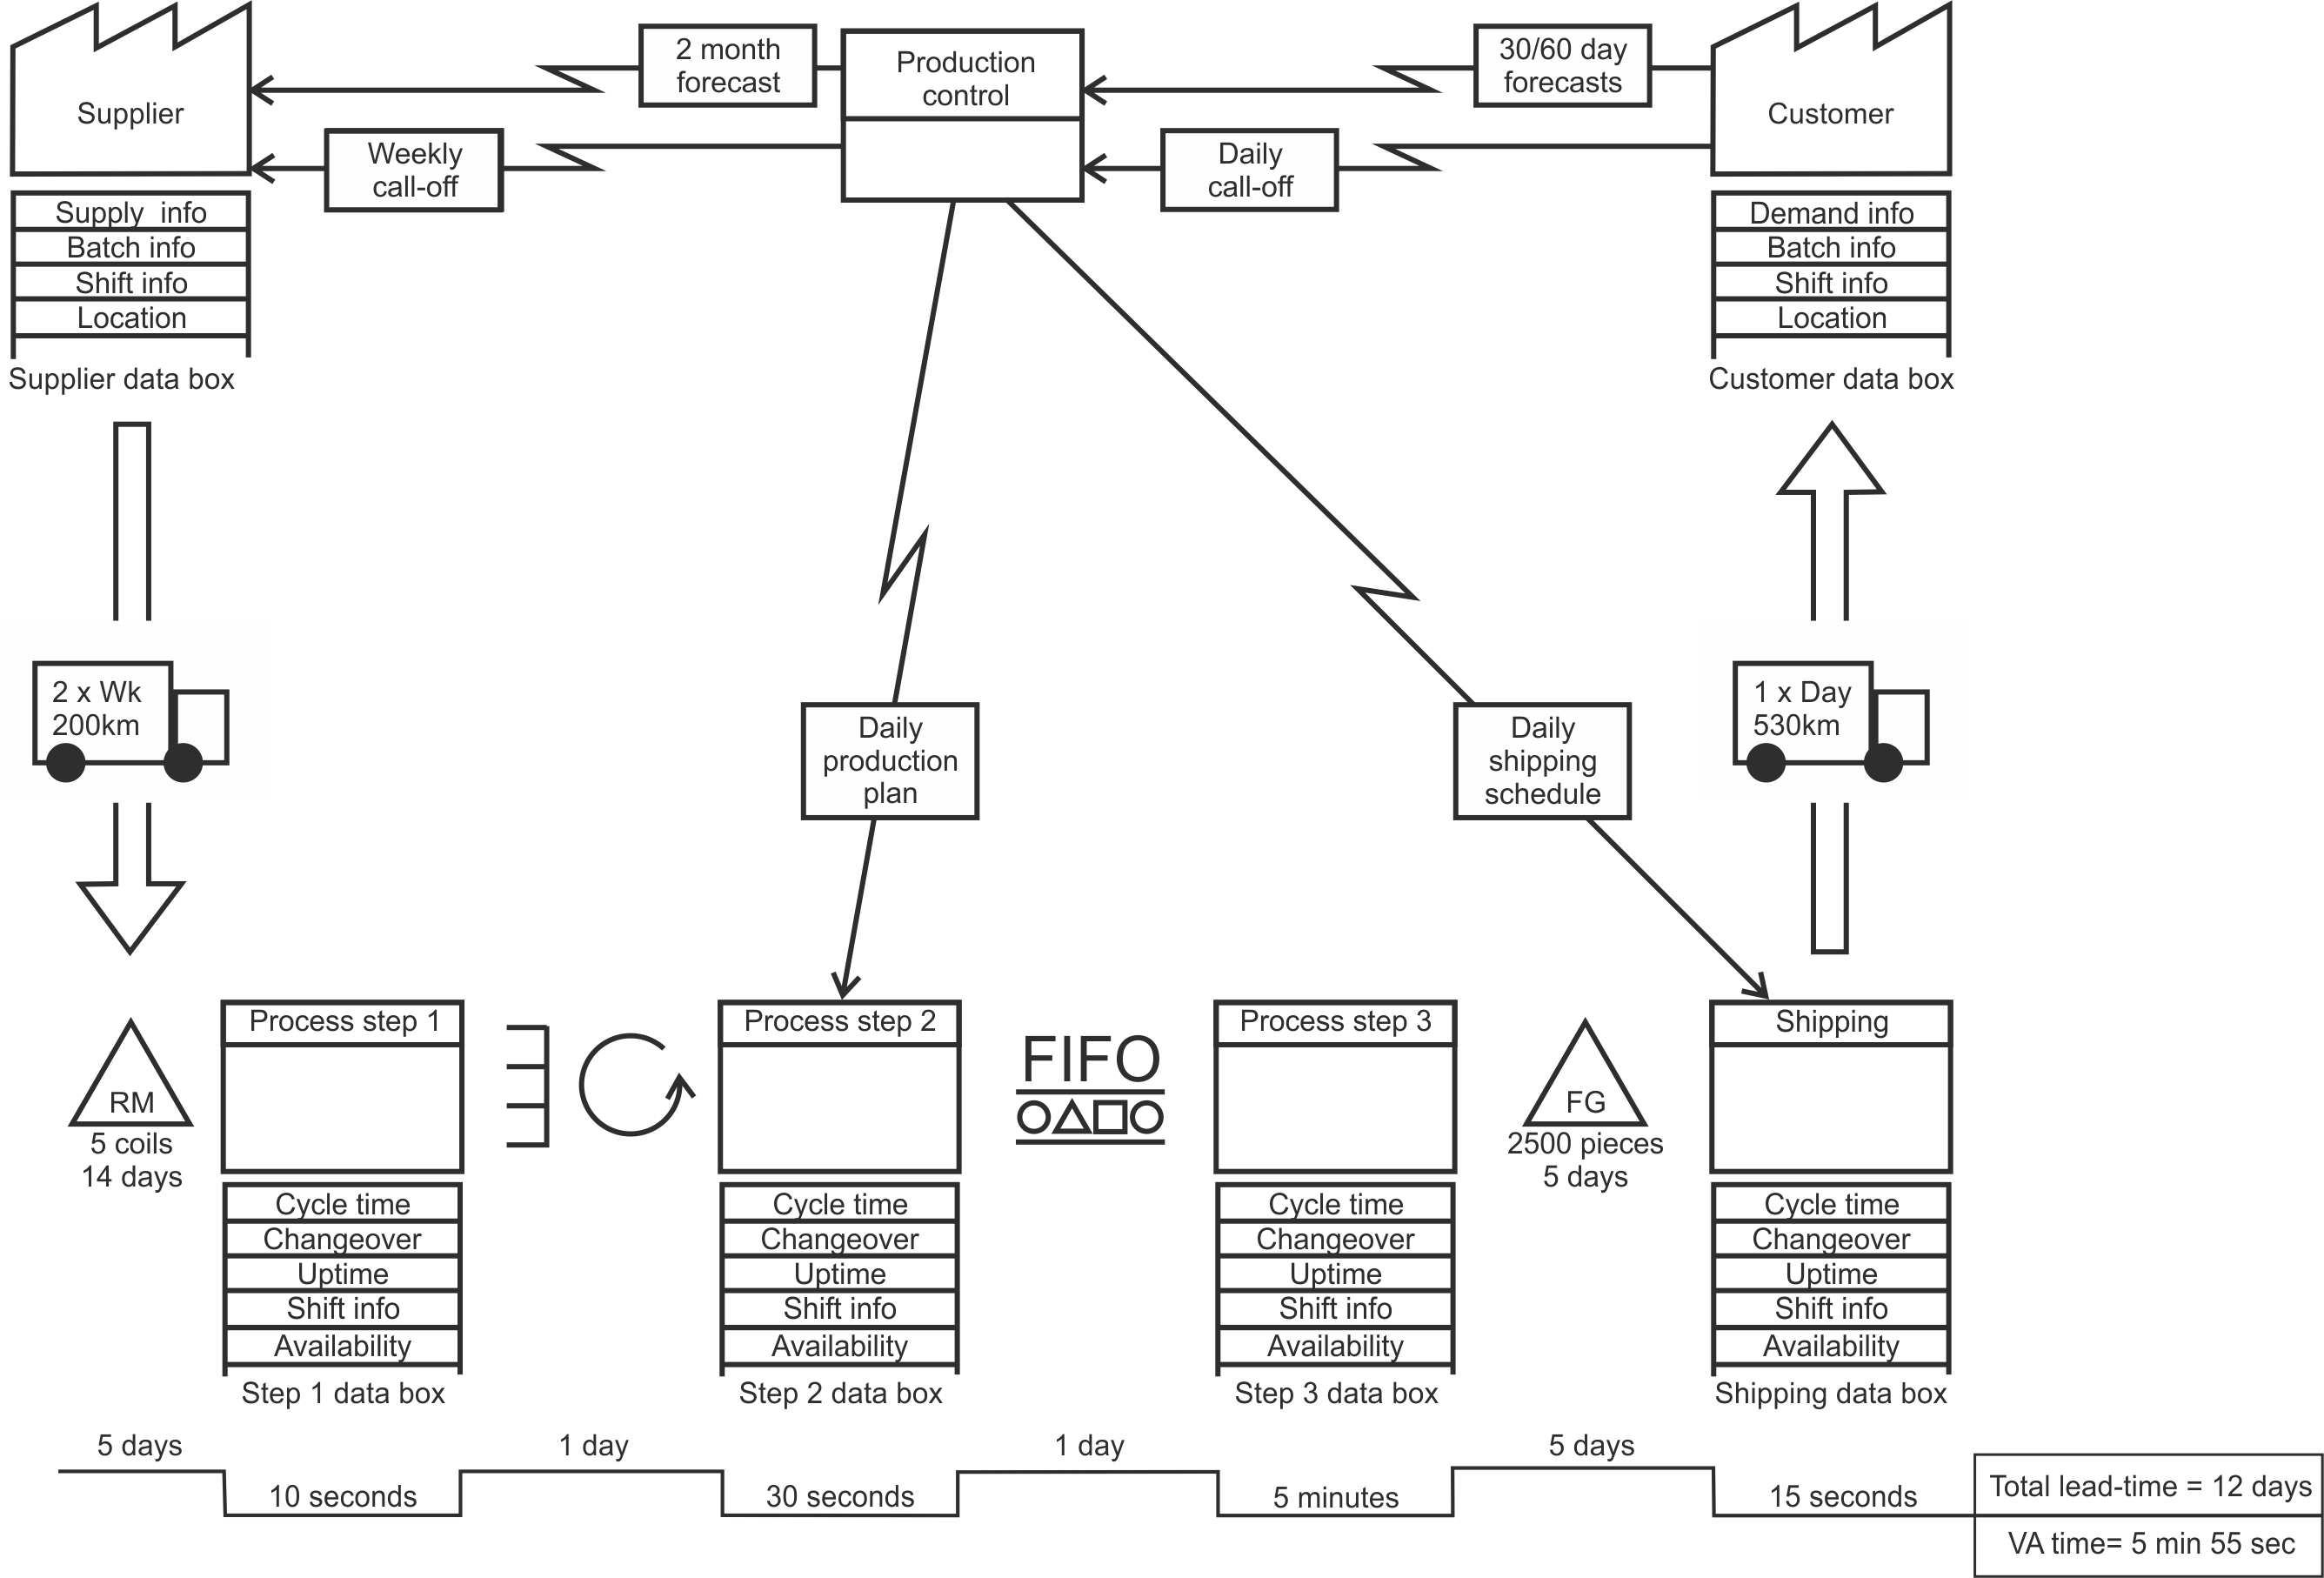
Figure A.2: Generic structure of a value stream map
The information flow originates from the customer. Call-off orders (the quantity required immediately) and future order forecasts (guidance on future orders) are past to production control department, who generate daily production plans and shipping schedules. The production plan is passed to the pacemaker (process step 2 in Figure A.2). The shipping schedule is sent to logistics department how organised the shipping of product to customers.
Downstream from the pacemaker, processes are controlled by FIFO queue discipline. Upstream from the pacemaker processes are control via the kanban supermarket. The pacemaker is often placed just downstream from the process steps that need to be operated in batch mode. The supermarket pulls product through the preceding step that, in turn, pull the product from the RMI.
There are (at least) three lead times in this map. There is the customer or delivery lead time, the time for a customer order to be received, and the customer to receive that product from FGI after shipping. There is a production lead time, the time from releasing the production plan to the shop floor, to receiving those products in the FGI. Finally there is a supplier lead time, the time from issuing a replenishment order to the supplier, to receiving those items into the RMI. Of course, if there are more that one supplier, customer, or product there may be many additional lead times.
Sometimes, at the very bottom of the page, the value adding and non-value adding time is illustrated. It is not unusual that the value adding time is a very small percentage of the total time, perhaps only fractions of a single percent.